Conversion path analysis in GA4
Conversion is the most important and interesting event for you. It is extremely interesting to know how this happened. What steps did customers take before downloading the file or purchasing the item? When a customer conversion occurs, it is rarely the customer's first interaction with your website or brand. To understand the steps, you need to look at the conversion paths that will illustrate the overall sequence of platforms and touchpoints involved.
You can use these insights to optimize your website or campaign to fit your customer journey.
In this article, I will explain what exactly you can find in the Advertising > Attribution > Conversion paths tab and what you should be looking for when planning a conversion path analysis.
The data visualization section allows you to identify the most valuable conversion paths. There are three categories of touchpoints: Early, Middle, and Last touchpoints. The aim of touchpoints is to inform us how each channel initiates and supports conversion activities.
The early touchpoints express the first 25% of customer interactions on the path (rounded to the nearest whole number). This segment is empty if the path has only one touchpoint.
The middle represents 50% of touchpoints in the path. If the path has < 3 touchpoints, this segment is empty.
The last category, shows the final 25% of touchpoints in the path, rounded up to the nearest whole number. If the path consists of just one touchpoint, this segment has the touchpoint.
You can click over the header and see conversion credit and the precise number of conversions.
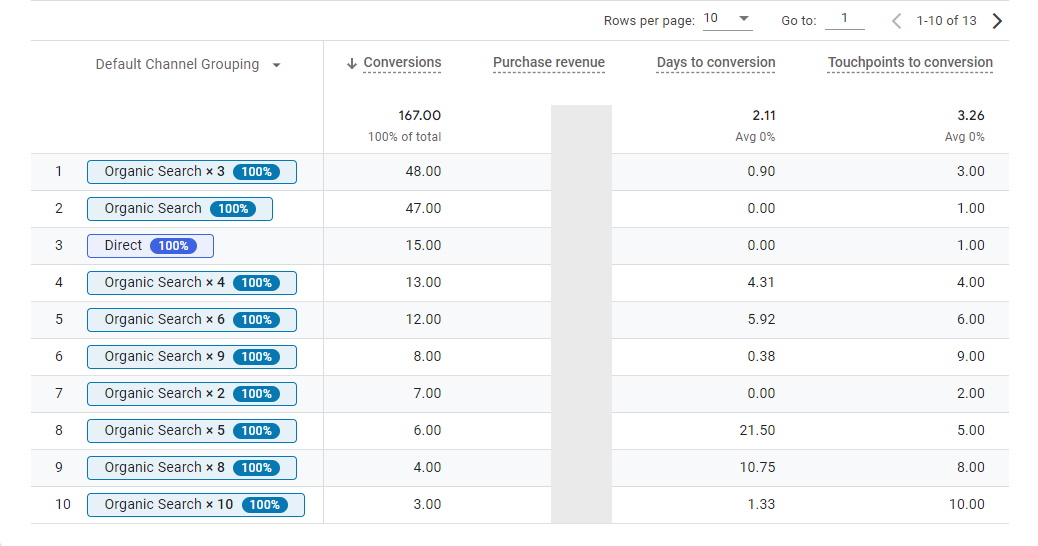
Let's look at the table below. What can we find in it? The table includes information about the number of conversion events, the sum of purchase revenue, the days to conversion (the time from the first touchpoint to the conversion), and also the number of touchpoints that create the conversion. All this information provides a valuable comparison that allows us to find out which channel brings real business value.

Channel Groupings are rule-based groupings of your traffic sources. In this report, you can see your data organized according to the Default Channel Grouping, a grouping of the most common sources of traffic, like Paid Search and Direct. This allows you to quickly check the performance of each of your traffic channels.
The drop-down at the chart's top displays data by source, medium, or campaign dimensions.
Using the conversion path report helps you analyze which channels at which stage of the path are supporting the conversion. In addition, they help to assess what are the most popular path patterns.
Anna Bacciarelli
During twelve years of professional work, I have gained experience in various positions in many fields. The variety of classes and professional experience taught me openness, independence, creativity, a positive approach to people and teamwork.Currently, I would like to focus on a new, extremely interesting path that is IT, and more specifically internet analytics. From the beginning of 2022, I have been gaining experience using the following tools: Google Analytics, Google Tag Manager and Google Data Studio.
If you enjoyed the article please share it:
The article "How to Configure User ID in Google Analytics 4" by Julius Fedorovicius, published on Analytics Mania, provides a comprehensive guide on implementing User ID tracking in Google Analytics 4 (GA4). This feature enables businesses to monitor user interactions across multiple devices and sessions, offering a unified view of user behavior.
 Review of Julius Fedorovicius' article
 Jan 06, 2025
Susan, an e-commerce entrepreneur, runs a thriving online store selling home decor. One day, her purchase funnel started showing a steep drop-off at the payment page. Unfortunately, Susan was unaware of this issue until weeks later, after losing significant revenue and customer trust. Why? She didn't have custom GA4 alerts set up to monitor her website metrics in real-time.
 Published by Piotr Ulacha
 Dec 30, 2024
Environment - is a set of necessary elements of technical / software infrastructure, which is the basis for the operation of a given website/application. Google Tag Manager environments are simply multiple versions of the same container. When we have a website with a different version for development, testing, production and QA, instead of creating separate GTM containers for each version, we can set up separate environments in the same container that will work independently in each version.
 Published by Anna Bacciarelli
 Jan 17, 2023
Some time ago I listened to a podcast from the Technical Marketing Handbook series from Simo Ahava, whose guest was Adam Halbardier from the Google Tag Manager product team. During the conversation, the topic of transparency of data handled by the Server-Side container appeared.
 Published by Mariusz Michalczuk
 Dec 04, 2022
If you plan email marketing campaigns you are interested in the same as with other campaigns, to measure their impact on your business. When you are starting with this topic it is good to know that without additional effort you will not be able to access this impact. You will see no results because Google Analytics will treat traffic from the email campaigns as direct traffic (when users are using your own app) or as referrals (when users are using web email clients).
 Nov 28, 2022


